
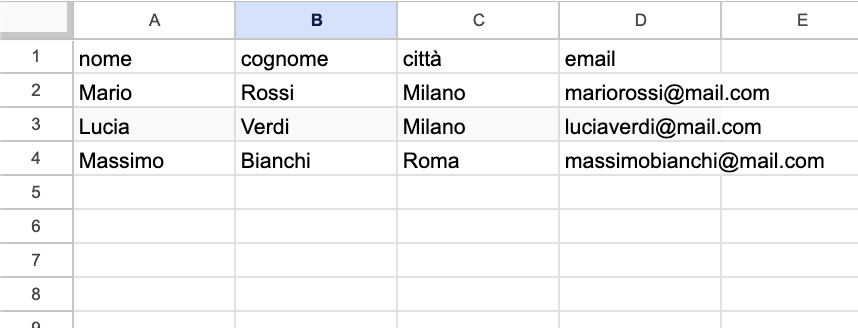
Lavorando in Google Sheets, spesso ti troverai di fronte a tabelle prive di qualsiasi formattazione, con dati che non possono essere aggregati. Devi ricordare a memoria in quale colonna si trova ciascun dato, altrimenti sei costretto a riaprire il foglio per scrivere formule che diventano illeggibili a causa dei numerosi riferimenti a celle di altri fogli o persino di altri file.
Insomma, tabelle un po’ come questa:
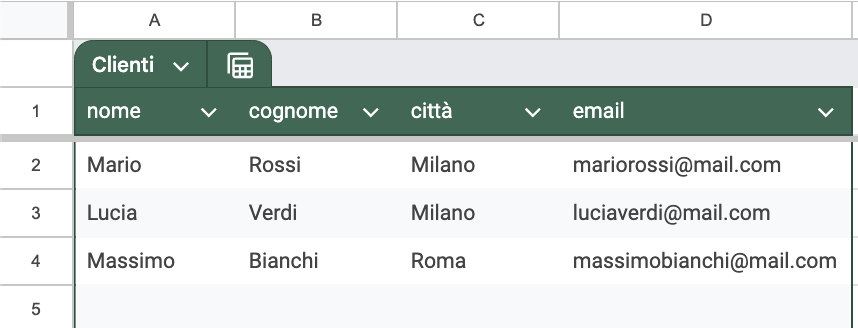
Grazie alla nuova funzione ‘Tabelle’ rilasciata da Google a maggio, i tuoi dati ora possono avere un aspetto molto più comprensibile. Ma non è tutto: avrai anche a disposizione nuove funzionalità, oltre a un design notevolmente migliorato.
Ecco come appare una Tabella:
Come si realizza una tabella?
Esistono diversi modi per inizializzare una tabella, a seconda della fonte dei dati che vuoi utilizzare. Puoi creare una tabella partendo dai template messi a disposizione da Google Sheets, utili se cerchi idee su come gestire un progetto. Oppure, se hai già chiara la struttura dei dati o vuoi trasformare in tabella un foglio che hai realizzato in precedenza, puoi creare una tabella direttamente dai tuoi dati.
Crea una Tabella da un template
Per creare una tabella partendo da un template, accedi al menu ‘Inserisci’ e clicca su ‘Tabelle’. In questo modo si aprirà una sidebar che mostrerà una selezione di tematiche e vari template da personalizzare per creare le tue tabelle. Ti basterà selezionarne uno e il foglio corrente si trasformerà in una tabella.
Crea una Tabella partendo dai tuoi dati
Realizzare una tabella è molto semplice. Seleziona una tua tabella esistente, poi clicca sul menu ‘Formato’ e successivamente su ‘Converti in Tabella’. A questo punto, la tua tabella sarà pronta per essere utilizzata.
Come customizzare la tabella
Quando crei la tua tabella, Google Sheets ti offre la possibilità di personalizzarla ulteriormente. Di seguito vedremo le principali e più importanti personalizzazioni:
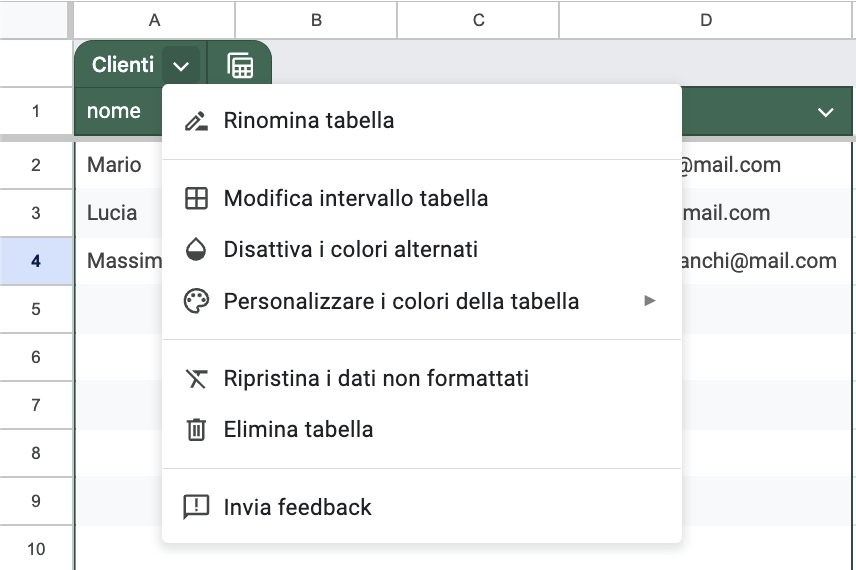
Modificare la tabella
Cliccando sulla freccia accanto al nome della tabella potrai:
- Rinominare la tabella
- Modificare l’intervallo della tabella
- Attivare / Disattivare i colori alternati della tabella
- Personalizzare i colori
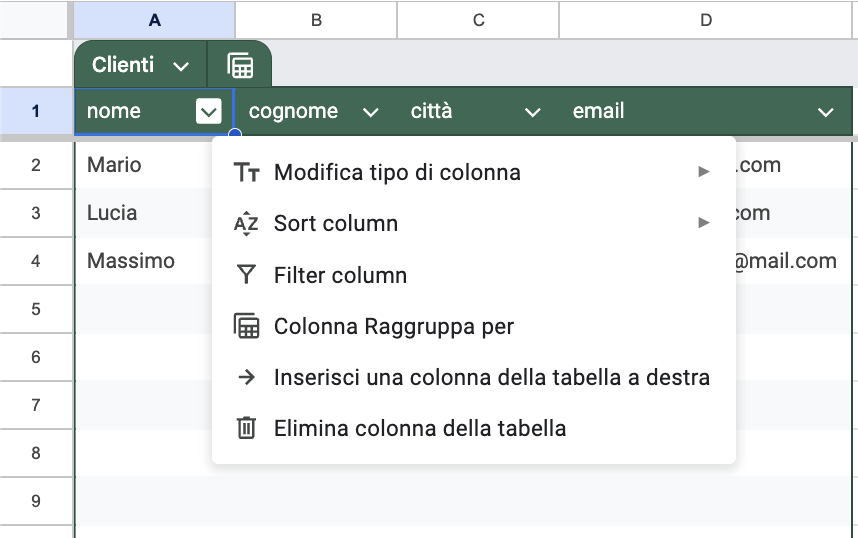
Modificare i dati
Cliccando sulla freccia per ogni colonna potrai:
- Modificare i tipi di colonna (Testo, valuta, data eccetera)
- Ordinare i dati della tabella sulla base della colonna selezionata
- Filtrare la tabella sulla base della colonna selezionata
- Raggruppare i dati della tabella secondo i dati presenti nella colonna selezionata
- Inserire una nuova colonna
- Eliminare la colonna
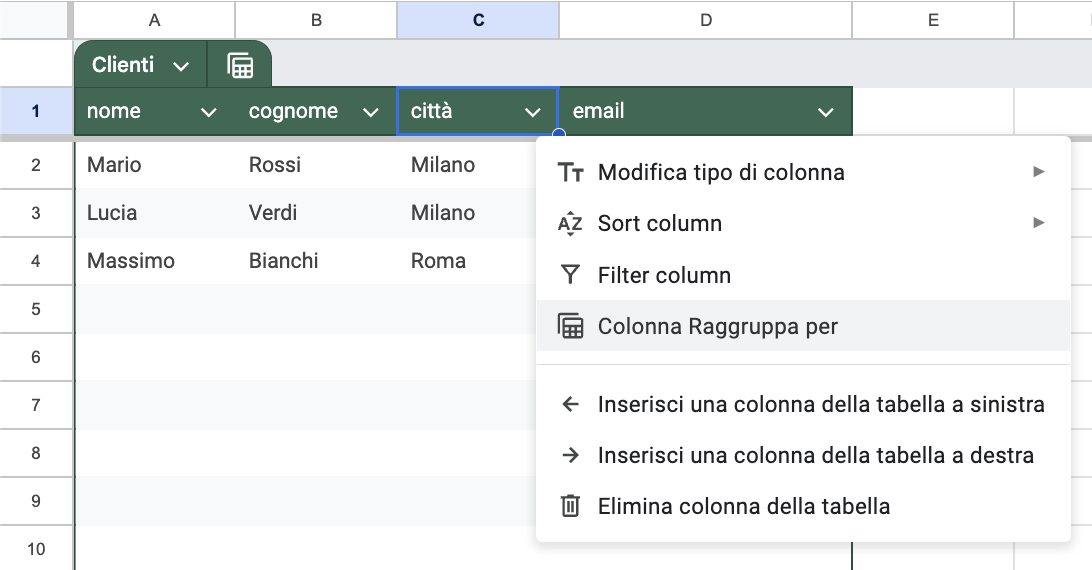
Di tutte le funzionalità citate, voglio soffermarmi sul raggruppamento dei dati. Ipotizziamo di aggiungere ai dati una colonna ‘città’ contenente la città di provenienza di ogni cliente. Potrai quindi raggruppare tutti i tuoi utenti per città di provenienza. Ti basterà cliccare sulla freccia accanto alla colonna ‘città’ e selezionare ‘Raggruppa per Colonna’.
Ed il risultato che otterrai sarà una cosa del genere:
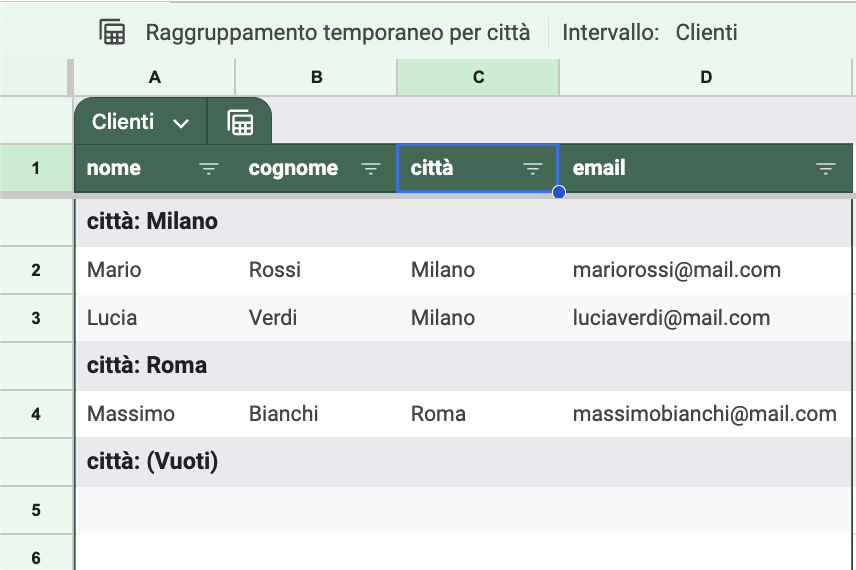
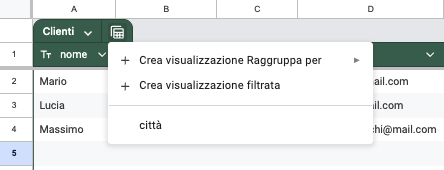
Ora i dati sono organizzati e raggruppati per città, migliorando incredibilmente l’esperienza di utilizzo di Google Sheets. Questo raggruppamento è semplicemente una visualizzazione raggruppata che puoi salvare e richiamare ogni volta che vuoi, cliccando sulla calcolatrice accanto al nome della tabella. Inoltre, sempre da quel menu, potrai creare e salvare altre visualizzazioni filtrate o raggruppate per la tabella.
Usare Tabelle nelle formule
Come dicevo, le tabelle non servono solo a dare un aspetto più accattivante ai tuoi dati. L’obiettivo di Google con questa nuova funzionalità è semplificare la vita agli utenti di Google Sheets, e devo dire che con la funzionalità che sto per mostrarti ci sono riusciti pienamente.
Come ho menzionato all’inizio di questo articolo, quando scrivo le mie formule (e credo sia lo stesso per te), spesso sono piene di riferimenti a numerosi fogli che contengono dati diversi. Ricordarmi ogni volta a quali dati fanno riferimento i vari riferimenti come B2:F C2:C diventa frustrante. Inoltre, le formule diventano illeggibili a colpo d’occhio, rendendo difficile capire cosa effettivamente fanno. Le nuove tabelle di Google Sheets sono progettate per risolvere proprio questo problema.
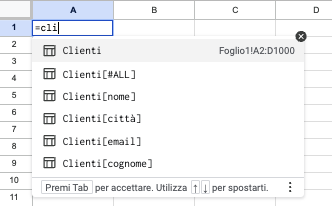
Quando crei una formula in Google Sheets e scrivi il nome della tua tabella, vedrai il suggeritore che ti propone diverse opzioni. Come puoi vedere nell’immagine qui sotto, nel caso specifico, “Clienti” corrisponde al range A2del Foglio1. La cosa incredibile è che potrai utilizzare “Clienti” nelle formule per fare riferimento al range completo, ossia Foglio1!A2.
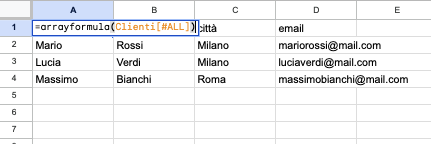
Questi riferimenti possono essere utilizzati in molti modi, ad esempio con un arrayformula per trasferire i dati della tabella su un altro foglio usando una formula.
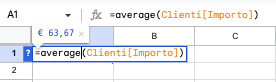
Oppure utilizzando operazioni matematiche, come calcolare la media della colonna ‘Importo’, creata appositamente per questo esempio.
Ti renderai conto da solo di quanto questo strumento semplifichi il lavoro, sia durante la scrittura che nella lettura delle formule che scrivi.
In conclusione
Google sta compiendo uno straordinario lavoro nel continuo miglioramento di Sheets, e i numerosi rilasci di nuove funzionalità dell’ultimo anno sono prova dell’impegno di Google nel potenziare questo strumento. Secondo me, Google Sheets sta diventando il principale punto di riferimento nei fogli di calcolo online.